Spatial Transformations and Regional Differences in the Medieval Kingdom of  Hungary (1000–1500)
Beatrix F. Romhányi
Károli Gáspár University of the Reformed Church
This email address is being protected from spambots. You need JavaScript enabled to view it.
Hungarian Historical Review Volume 13 Issue 3 (2024): 339-360 DOI 10.38145/2024.3.339
Spatial transformations of the economies and/or demographic trends of pre-modern European kingdoms are difficult to assess, as statistical data are not available. However, it is possible to create large data sets using different types of sources, including written and archaeological, which can be used as indicators of relative population density, economic activity, and regional differences. Although most of these data included are qualitative in nature and many can only have binary values (0 or 1), the use of a large number of variables has led to reasonable results that can be compared with the results of analyses in later periods. Most of the data available are related mainly either to agriculture or ecclesiastical institutions (parishes and monasteries). The period before the Mongol invasion in 1241 is mainly represented by archaeological data, while for the fourteenth and fifteenth centuries there are considerably more written sources. One of the most important sources is the papal tithe register of 1332–1337, the only tax in Hungary directly related to the differences in agricultural incomes. However, the focus of this paper is not on individual time periods, but on the spatial changes that occurred within the medieval Kingdom of Hungary between the eleventh and fifteenth centuries, with a particular emphasis on possible driving forces behind these changes and various regional differences.
Keywords: Middle Ages, Kingdom of Hungary, regional differences, spatial transformations, long-term processes
Introduction
While the comparative study of regional differences has become an increasingly important approach in the research undertaken in recent decades, researchers face serious challenges when attempting such comparisons from a diachronic point of view. First, they must address problems concerning the changing significance of the indicators. Second, they must grapple with the problem of the changing or unknown boundaries of the territorial units analyzed.1 If one goes further back in time, a third major difficulty arises: the lack of statistically analyzable, serial or at least numerical data. However, the possibility of processing large and complex data sets containing both qualitative and quantitative data offers a new perspective for diachronic research and may help historians overcome these difficulties. In recent years, such data sets were compiled for the medieval Kingdom of Hungary, using a combination of written and archaeological evidence. Collaboration with geographers and historians who focus on later periods added a lot to the methodology and inspired new research projects, one of which started in 2024 and aims to develop the already existing medieval data set further and connect it to the databases relevant to the modern period.2 In the discussion below, I focus on some lessons of this series of analyses, calling attention in part to how different types of agricultural incomes (basically, those characteristic of rural areas) can be represented visually and interpreted based on the available evidence.
Sources, Possibilities, and Limitations
The sources for such a database are partly written and partly archaeological. For the earlier period, i.e. the period before the Mongol Invasion in 1241–1242, archaeological evidence predominates, while from the second half of the thirteenth century onwards written evidence becomes more and more important. The problem with most of the data is that, unlike the data used in modern statistical surveys, they cannot be linked to a single date and sometimes not even to a clearly defined, brief period. The only exception is the Papal tithe register of 1332–1337, which can be supplemented by the Zagreb register of 1334.3 These two sources cover nearly 90 percent of the parish network in the early fourteenth century. Thus, in this case too, additional sources from a longer period need to be consulted to fill in the missing data.
Another problem is the lack of continuous variables for most of the period. Hardly any tax censuses survive, and those that do survive do not cover the whole of the kingdom. Furthermore, the royal tax levied on tenant peasants was not dependent on income. The amount was the same, rather, for all taxpayers. Again, the only exception in this case was the papal tithe, since the tax paid by the priests to the papal curia was related, albeit indirectly and in a somewhat complicated way, to the agricultural incomes of the faithful who paid the church tithe.
Given the limitations and difficulties mentioned above, other methods are needed to measure regional differences before modern statistical data collection became a common practice. First, a combination of well-defined historical, art historical, and archaeological data needs to be compiled in a complex database. These data then need to be assessed as a proxy for development. As their relevance changes over time (for example, the presence of certain institutions, the value of privileges, or indicators such as literacy do not always reflect the same position in the settlement hierarchy), the validity of proxy data needs to be reassessed in each context.
Since life in medieval European societies was closely linked to a network of religious institutions, such as parishes and monasteries, data concerning these institutions can also serve as the basis for the database. Unlike many other phenomena in this part of Europe, these institutions are also well documented and can be (or were) precisely dated (on the basis of either written sources or archaeological/art historical evidence). Furthermore, as they were ubiquitous throughout Latin Europe, the basic structure of the network did not differ significantly from region to region. This allows for meaningful comparison of the data, even between distant parts of the continent.
One may ask why it is worth setting up such databases and analyzing them in a comparative way. Even if there are no statistical data for the medieval and early modern periods, pilot projects, such as those depicted on Maps 1 and 2, have shown that well-defined indicators and appropriate methods of creating visual depictions can lead to new, meaningfully interpretable results. In this way, we can identify long-term processes, stable and changing elements of spatial patterns, and periods of transformation. These periods of transformation do not necessarily coincide with the turning points defined by political history. This new approach thus calls attention to the importance of other factors, such as environmental changes, changes in the way of life, and technical developments, which may well have influenced settlement patterns and economic activity more than politics.
Furthermore, this methodology makes it possible to link longer historical periods and draw comparisons between data concerning recent times and data relevant to considerably earlier periods (and significantly, even to arrive at new comparisons of the pre-Ottoman period and the post-Ottoman period). This is particularly important, as the Ottoman period caused a well-known rupture in many respects, and the fragmentation of the medieval Kingdom of Hungary during the sixteenth and seventeenth centuries, combined with the large-scale loss of sources and the profound transformation of both estate structure and society, led to discontinuities in the historical narratives and made it difficult to model the changes that took place.
This kind of research also promises to further a more nuanced understanding of how certain regions became developed or underdeveloped. Which regions enjoyed periods of continuous development, and which remained less active? If we can answer these questions with reasonable accuracy, these findings may well contribute to a better grasp of long-term processes in the past and even prospective for regional planning today.
There are limitations on the potentials of this research, however. The data sets are very different in size (from a few hundred entities—based on both written and archeological evidence—for the period of the foundation of the kingdom c. 1000 to about 15,000 entities for the end of the Middle Ages), and the data themselves are of different types, ranging from serial sources related to economy such as the papal tithe register to individual sources reflecting cultural achievements such as the schools, students attending universities or even organs and tower-clocks. Furthermore, even for individual settlements, the data are very uneven, making it impossible to interpret development levels at the settlement level. A partial exception is the group of the privileged towns throughout the Middle Ages. It is also important to note that, in the absence of serial sources, data must be collected over longer periods, often several decades. The criteria for data collection must therefore be precisely defined and strictly adhered to. However, even so, the results of the analyses cannot be tied to an exact year or even decade. A certain level of uncertainty remains, which means that only changes between relatively distant time periods (at least a hundred years) can be assessed.
One further difficulty is that data from the period after the Mongol Invasion are mainly available for settlements with parish churches. This is evident in the case of the dataset for the 1330s. Even if there are data for settlements that are not mentioned in the papal tithe list, alone the fact that the papal tithe is an exceptional continuous variable implies that settlements not on the list can be included in the database under very strict conditions. To safeguard the integrity of the dataset, only parishes can be integrated, even more so, as we have some data concerning the amount of the tithe paid by the parishes not listed. In the late medieval database, the challenge is different. As there is no continuous variable we could use, actual data collection at the settlement level is necessary and fortunately also possible (at least theoretically) due to the much larger quantity of written evidence. However, additional data are available for only one third of the documented settlements. This means that an analysis based on raw data would use up a lot of entities that can be localized but for which no other data are available. These data thus have no real value. As the analysis of such a database would lead to distorted result. Again, the solution is to aggregate the data by parish so that the analysis can be based on a differentiated data set. Fortunately, the parish was the basic administrative unit in much of Europe between the late thirteenth and late eighteenth centuries, for instance in France and England, as well as in the Kingdom of Hungary. Thus, the use of parishes as a basis for data analysis is not only necessary but also consistent with the reality of the period.
In the following, I will present some results of the analysis of the datasets for 1220 and 1330 (marked in bold in Table 1), because the dataset for 1100 is too small for a complex analysis, and the construction of the database for the late Middle Ages has just begun. These two datasets will serve as comparative material for some aspects of the argument.
The Database
Table 1. Composition of the data sets of the periods of time investigated
|
c. 1100 |
c. 1220 |
c. 1330 |
c. 1500 |
|
c. 700 entities |
c. 2,300 entities (including passes) |
c. 4,200 entities (“municipalities” / parishes) |
c. 15,000 entities |
|
Bishops’ sees |
All data types for the time c. 1100 |
PAPAL TITHE LIST (completed with related, |
Legal indicators |
|
Collegiate chapters |
Charter evidence |
Lay and ecclesiastical administration |
Ecclesiastical indicators |
|
Monasteries |
Narrative sources (domestic |
Mendicant friaries |
Economic indicators |
|
Monastic estates |
Privileged ethnic groups |
Economic and/or judicial centers |
Cultural indicators |
|
County castles, other strongholds |
Market, toll, ford |
Markets, fairs |
Other specific data |
|
Rural churches, churchyards |
Economic and judicial centers |
Urban privileges |
As can be seen from the data structures described in Table 1, it was necessary to create a composite “development score” based on weighted data and to establish development levels to ensure comparability. The size of the database for the early thirteenth century is about half the size of that for the 1330s and consists of c. 2,250 entities. Empirical research has shown that this is the minimum number of entities required to model regional differences in the Carpathian Basin as a whole. Therefore, the database for the late eleventh and early twelfth centuries has not been transformed into a visual representation in the same way (Map 3) and is not discussed in this article. As for the database for the Late Middle Ages (c. 1500), it has just been established, and substantial datasets will be uploaded later.
The Findings and Conclusions
Two primary outputs were produced: maps illustrating the hierarchy of settlements (Maps 1–2) and diagrams showing the development slopes (N–S and W–E, Figs 1–2). With regard to the maps, it is important to stress that, despite the collection of data at the settlement level, the analysis can only be carried out at the regional level, i.e., only the regional level can be interpreted in a historically meaningful way. The difference between the two maps is obvious at first glance: while the peripheral areas, which were barely inhabited at the beginning of the thirteenth century, were filled with settlements a century later, the central parts of the Great Plain were depopulated. At the same time, the marked contrast in settlement density between the western and eastern parts of the Carpathian Basin almost disappeared. This pattern of the settlement and parish network proved enduring. It can be seen not only on the map for 1500, but also up to the early twentieth century (Maps 4–6). It is even represented on the Lazarus-map (1528, Fig. 3) and to some extent also on the Lazius-map (1556). The latter is important because it also depicts the cause of this emptiness in a very spectacular way, showing cattle in the region and adding the inscription Cumanorum Campus, Bachmege deserta, pascendis pecoribus apta.4
The difference in developmental slopes is also instructive (Figs 1–2). On the one hand, there is no significant difference between the north-south transects. In both periods, the center of gravity was in the north. On the other hand, a shift can be observed in the west-south transects. While before the Mongol Invasion the western part of the kingdom was clearly more densely populated and therefore more active (more developed), the diagram for the 1330s shows a roughly even level of development, where only the periphery appears to be underdeveloped, or rather underpopulated and therefore less active.
In the creation of visual representations of the data for the 1330s, the problem of the missing parish boundaries arose almost immediately. While certain features can be represented using points, the visual depiction of regional differences can be distorted by the fact that large parts of the Carpathian Basin were characterized by a loose parish and settlement network. However, the fourteenth-century boundaries remain unknown for the overwhelming majority of the parishes. To overcome this problem, actual parish boundaries were substituted with Voronoi cells (Map 7). As parish churches served the everyday needs of pastoral care and the distances between the places in which people resided and the places where Sunday masses were held offer a good indicator of the spatial distribution of the population, the Voronoi diagram will define the areas which were closer to a given parish church than to any other parish church in the neighboring cells. This diagram thus offers a usable substitute with which to model the medieval parish system.
In this way, tithe per area unit could be calculated, and differences in certain types of land use became clear. The structure of the settlement system, including the absence of certain types of settlement, was also instructive. In southern Transdanubia, for instance, where a very dense parish network developed before the 1330s, the parsons usually paid a low (sometimes very low) sum as papal tithe. This would suggest that they had rather modest incomes. Based on this, one would conclude that the population of the region was poor. However, when projecting these sums on the Voronoi diagram representing the territory of the parishes, the picture changes radically. Based on the tithe per area unit, parts of Baranya, Somogy, Tolna, and to some extent even Vas and Zala Counties produced high values compared to other parts of the kingdom (Map 8).5 This means that agriculture was intensive and lucrative in this part of the Carpathian Basin, and a large proportion of land, maybe around or slightly above 30 percent, was ploughed (the national average was below 20 percent). Incomes from agriculture were relatively high in part thanks to viticulture, which seems to have been continuous in the region since Roman times.6 The average size of the tenant hides in this region support this conclusion, as do data concerning very small plots in Baranya County.7 Also, while in most parts of the kingdom an acre of c. 0.34 ha was used and approximately 120 acres were counted for a tenant hide, in this part of Hungary both the size of the acre and the number of acres per tenant hide were lower. It is even possible that in some parts of the region the Roman iugerum (0.25 ha) survived as a measurement unit, albeit the general the so-called “small acre” was used, a unit of measurement equal to c. 0.28 hectares.8
When speaking about the structure of the local settlement network, it is important to keep in mind the substantial differences between the different regions of the kingdom. For instance, southern Transdanubia, mentioned above, was (and is) a very rural region where there were very few towns in the Middle Ages.9 The Turopolje region and Lower Slavonia, south of the Sava, as well as the Székely Land in Transylvania appear even more rural, and they both had a very low tithe per area unit ratio. At first glance, one would interpret this feature as a sign of poverty, but certain types of animal husbandry, especially sheep farming, could also contribute to that picture. Nevertheless, it is also clear that neither the Turoploje nor the Székely Land were among the wealthiest regions of fourteenth-century Hungary. On the opposite end of the imaginary scale, we find the northern mining district. In this highly urbanized region, which had important towns which paid high sums to the papal tithe collectors, there were few villages. We can count on a similarly incomplete settlement network, but with much smaller (and in the fourteenth century less wealthy) towns in the Great Hungarian Plain and Máramaros County. In the first case, this relative lack of network development was caused by large-scale livestock farming, which was widespread in the region since the mid-thirteenth century. In the second case, it was a consequence of the salt mining industry, which was the basis of the local economy. On the Great Hungarian Plain, the low number of villages compared to the emerging market towns is a fairly well-known thing, and the high lucrativity of animal husbandry was no surprise either. But the outstanding position of Máramaros County as early as in the 1330s was surprising, because there is later written evidence indicating the importance of salt exploitation there. However, the position of Máramaros County was also a consequence of the fact that there were only a handful of well-off, comparatively urban settlements, and the surrounding mountainous area was almost completely uninhabited at the beginning of the fourteenth century. Thus, the incomplete settlement network, which in these cases was a consequence of the virtual absence of villages, appears at a higher level of development than expected.
The consequences of the above are somewhat paradoxical, but understandable. It is clear that urbanization significantly contributed to regional development level in the Middle Ages. But this does not necessarily explain changes in the individual income levels (the living standard) of the inhabitants of the given region. Regions with specific products such as minerals (ores or salt) or livestock usually require complex trade networks not only to sell their products but also to buy food, especially grain. Both the basis of their economy and the need to supply the population with food favored a comparatively high population density, which means the development of towns and cities. As such commodities can be produced in regions where agriculture is limited either by natural circumstances or by the type of economy itself (the need for large pastures), the village will more or less become the missing element in the settlement network. The higher level of urbanization, in turn, will lead to the emergence of more complex social and economic systems, even without the presence of institutions representing central or local power (although these institutions will of course appear in such central places). However, the essentially rural character of a region and the lack of anything resembling urban settlements, which in a modern context would be considered signs of underdevelopment and poverty, should not be perceived as such in medieval times. Also, one has to be aware of changes over time. For instance, agriculture and viticulture seem to have provided considerable incomes, while transhumant sheep-farming was not (yet) a lucrative sector in the fourteenth century, but this seems to have changed in the following century, even if sheep-farming did not become a leading economic sector (in contrast with cattle-farming). Therefore, one has to be very careful when interpreting the regional differences visible on the maps. To arrive at better models of settlement structures and developmental levels in the Middle Ages, different methods of modeling are required, as well as complex narratives that deal with spatial and sectoral changes.
Moreover, the analysis of several aspects of the medieval and early modern spatial organization in the Carpathian Basin yielded an important finding. As noted above, major political events that marked the region between the Migration Period and the end of the Ottoman occupation (e.g., the collapse of the Avar Khaganate c. 800, the Hungarian conquest c. 900, the foundation of the Kingdom of Hungary in 1000, the Mongol Invasion of 1241–1242, the Battle of Mohács in 1526, and the Peace of Karlovac in 1699) are not reflected in the changes of spatial patterns. This means that the changes happened independently from the political events and the changing political systems. Patterns of landscape use remained essentially unchanged between the eighth and twelfth centuries, with some elements that can be traced back to the late Roman period. The transformation that took place in the long thirteenth century began well before and independently from the Mongol Invasion, and the process did not end before the first third of the fourteenth century. The new spatial structure, which stabilized by the mid-fourteenth century, persisted throughout the early modern period, despite the Ottoman occupation, and it only began to fade as late as in the last decades of the eighteenth century. Driving factors in the thirteenth-century transformation were environmental changes (a changing water regime, aeolian sand movement), dynamically increasing population (intense immigration from West and East), and new commercial and technical possibilities (the development of the mining districts due to the increasing demand for precious metals, including gold, silver, and copper, as well as changing land use in the Great Hungarian Plain to meet the demand for cattle). The newly emerging and growing sectors (mining, livestock farming) also resulted in intense internal migration.
Thus, regional characteristics can be much more persistent than presumed, and the interpretation of the stability or instability of these patterns demands a more complex approach. Speaking about long-term characteristics, we have to acknowledge, for instance, that the Budapest–Vienna economic axis, sometimes referred to as a result of the policy of the Habsburgs, who sought access to resources in the Kingdom of Hungary, seems to be much older and was present (and left discernible traces) even in the Roman period (and thus could be referred to as the “Aquincum–Vindobona axis”), which means that it was (and still is) the main development agent of the Carpathian Basin10 and proved so strong and enduring that it was only cut in the middle of the twentieth century, with the fall of the Iron Curtain. On the other hand, the active and inactive periods of specific regions need to be looked at more attentively, and we have to look for explanations that are more complex than the narratives that refer almost exclusively to political or military events. For instance, environmental changes, technical development, changing energy sources, and even changing external relations seem to have been decisive driving factors in certain transformations.
Bibliography
Buturac, Josip. “Popis župa Zagrebačke biskupije 1334. i 1501. godine” [Description of the County of Zagreb bishopric 1334 and 1501 years]. Starine [JAZU] 59 (1984): 43–108.
Demeter, Gábor, István Papp, Beatrix F. Romhányi, and János Pénzes. “A területi egyenlőtlenségek településszintű vizsgálata a történeti Magyarország és utódállamai területén, 1330–2010 (I)” [Long-term study of territorial inequalities at settlement level in the territory of the historical Hungary and its successor states, 1330–2010 (I)]. Területi Statisztika 63 (2023): 271–99. doi: 10.15196/TS630301
F. Romhányi, Beatrix. “A középkori magyar plébániák és a 14. századi pápai tizedjegyzék” [The medieval Hungarian parishes and the fourteenth-century papal tithe register]. Történelmi Szemle 61 (2021): 339–60.
F. Romhányi, Beatrix. “Plébániák és adóporták: A Magyar Királyság változásai a 13–14. század fordulóján” [Parishes and hides: the transformation of the Kingdom of Hungary around 1300]. Századok 156 (2022): 909–42.
F. Romhányi, Beatrix, Gábor Demeter, and Zsolt Szilágyi. “A Magyar Királyság regionális különbségei a pápai tizedjegyzék keletkezése idején” [Regional differences of the Kingdom of Hungary in the period of the papal tithe register]. In Magyar Gazdaságtörténeti Évkönyv 2022, edited by Gábor Demeter, Boglárka Weisz, and Ágnes Pogány, 17–52. Budapest: Bölcsészettudományi Kutatóközpont, 2023.
Kubinyi, András. “Mezővárosok egy városmentes tájon: A középkori Délnyugat-Magyarország” [Market towns in region without towns: Medieval southwestern Hungary]. In A tapolcai Városi Múzeum közleményei 1, ed. Zoltán Törőcsik, 319–35. Tapolca: Városi Múzeum, 1989.
Müller, Róbert. A mezőgazdasági vaseszközök fejlődése Magyarországon a késővaskortól a törökkor végéig [The development of agricultural iron tools in Hungary from the Late Iron Age until the end of the Ottoman occupation]. Zalai gyűjtemény 19. Zalaegerszeg, 1982.
Rationes collectorum pontificorum. Pápai tizedszedők számadásai 1281–1375. Edited by Arnold Ipolyi. Monumenta Vaticana I/1. Budapest, 1887.
Tímár, Gábor, Gábor Molnár, Balázs Székely, and Katalin Pilhál. “Orientation of the Map of Lazarus (1528) of Hungary: Result of the Ptolemian Projection? In Cartography in Central and Eastern Europe, edited by Georg Gartner, and Felix Ortag, 487–96. Berlin–Heidelberg: Springer, 2010. doi: 10.1007/978-3-642-03294-3_31

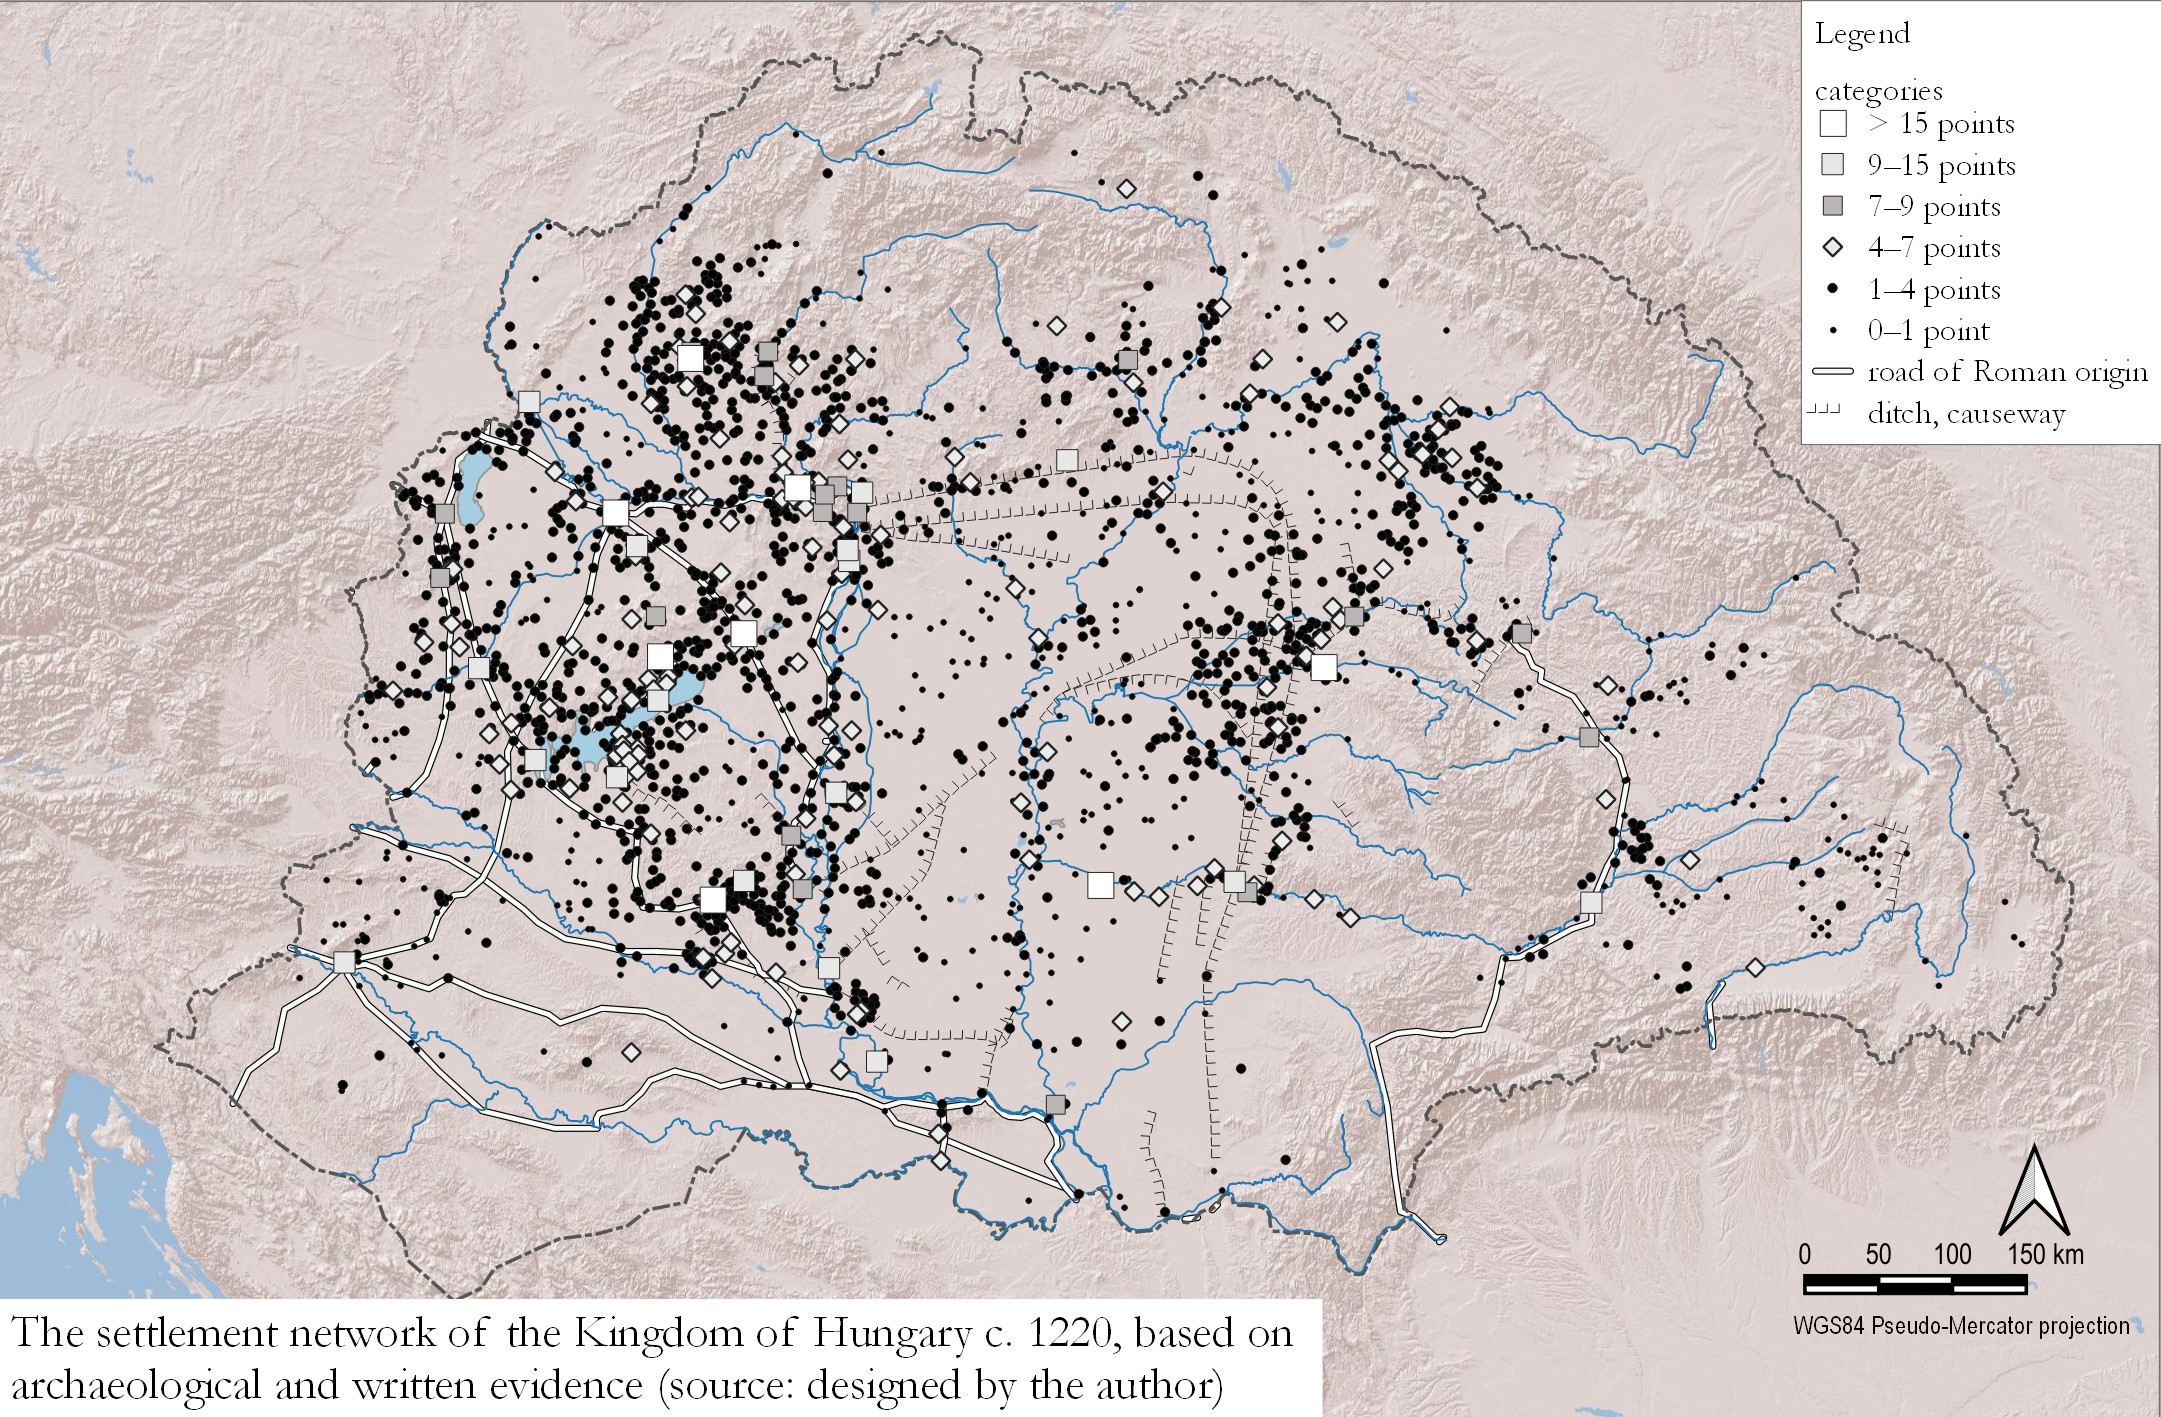
Map 1. The settlement network of the Kingdom of Hungary c. 1220, based on archaeological and written evidence. Source: designed by the author.

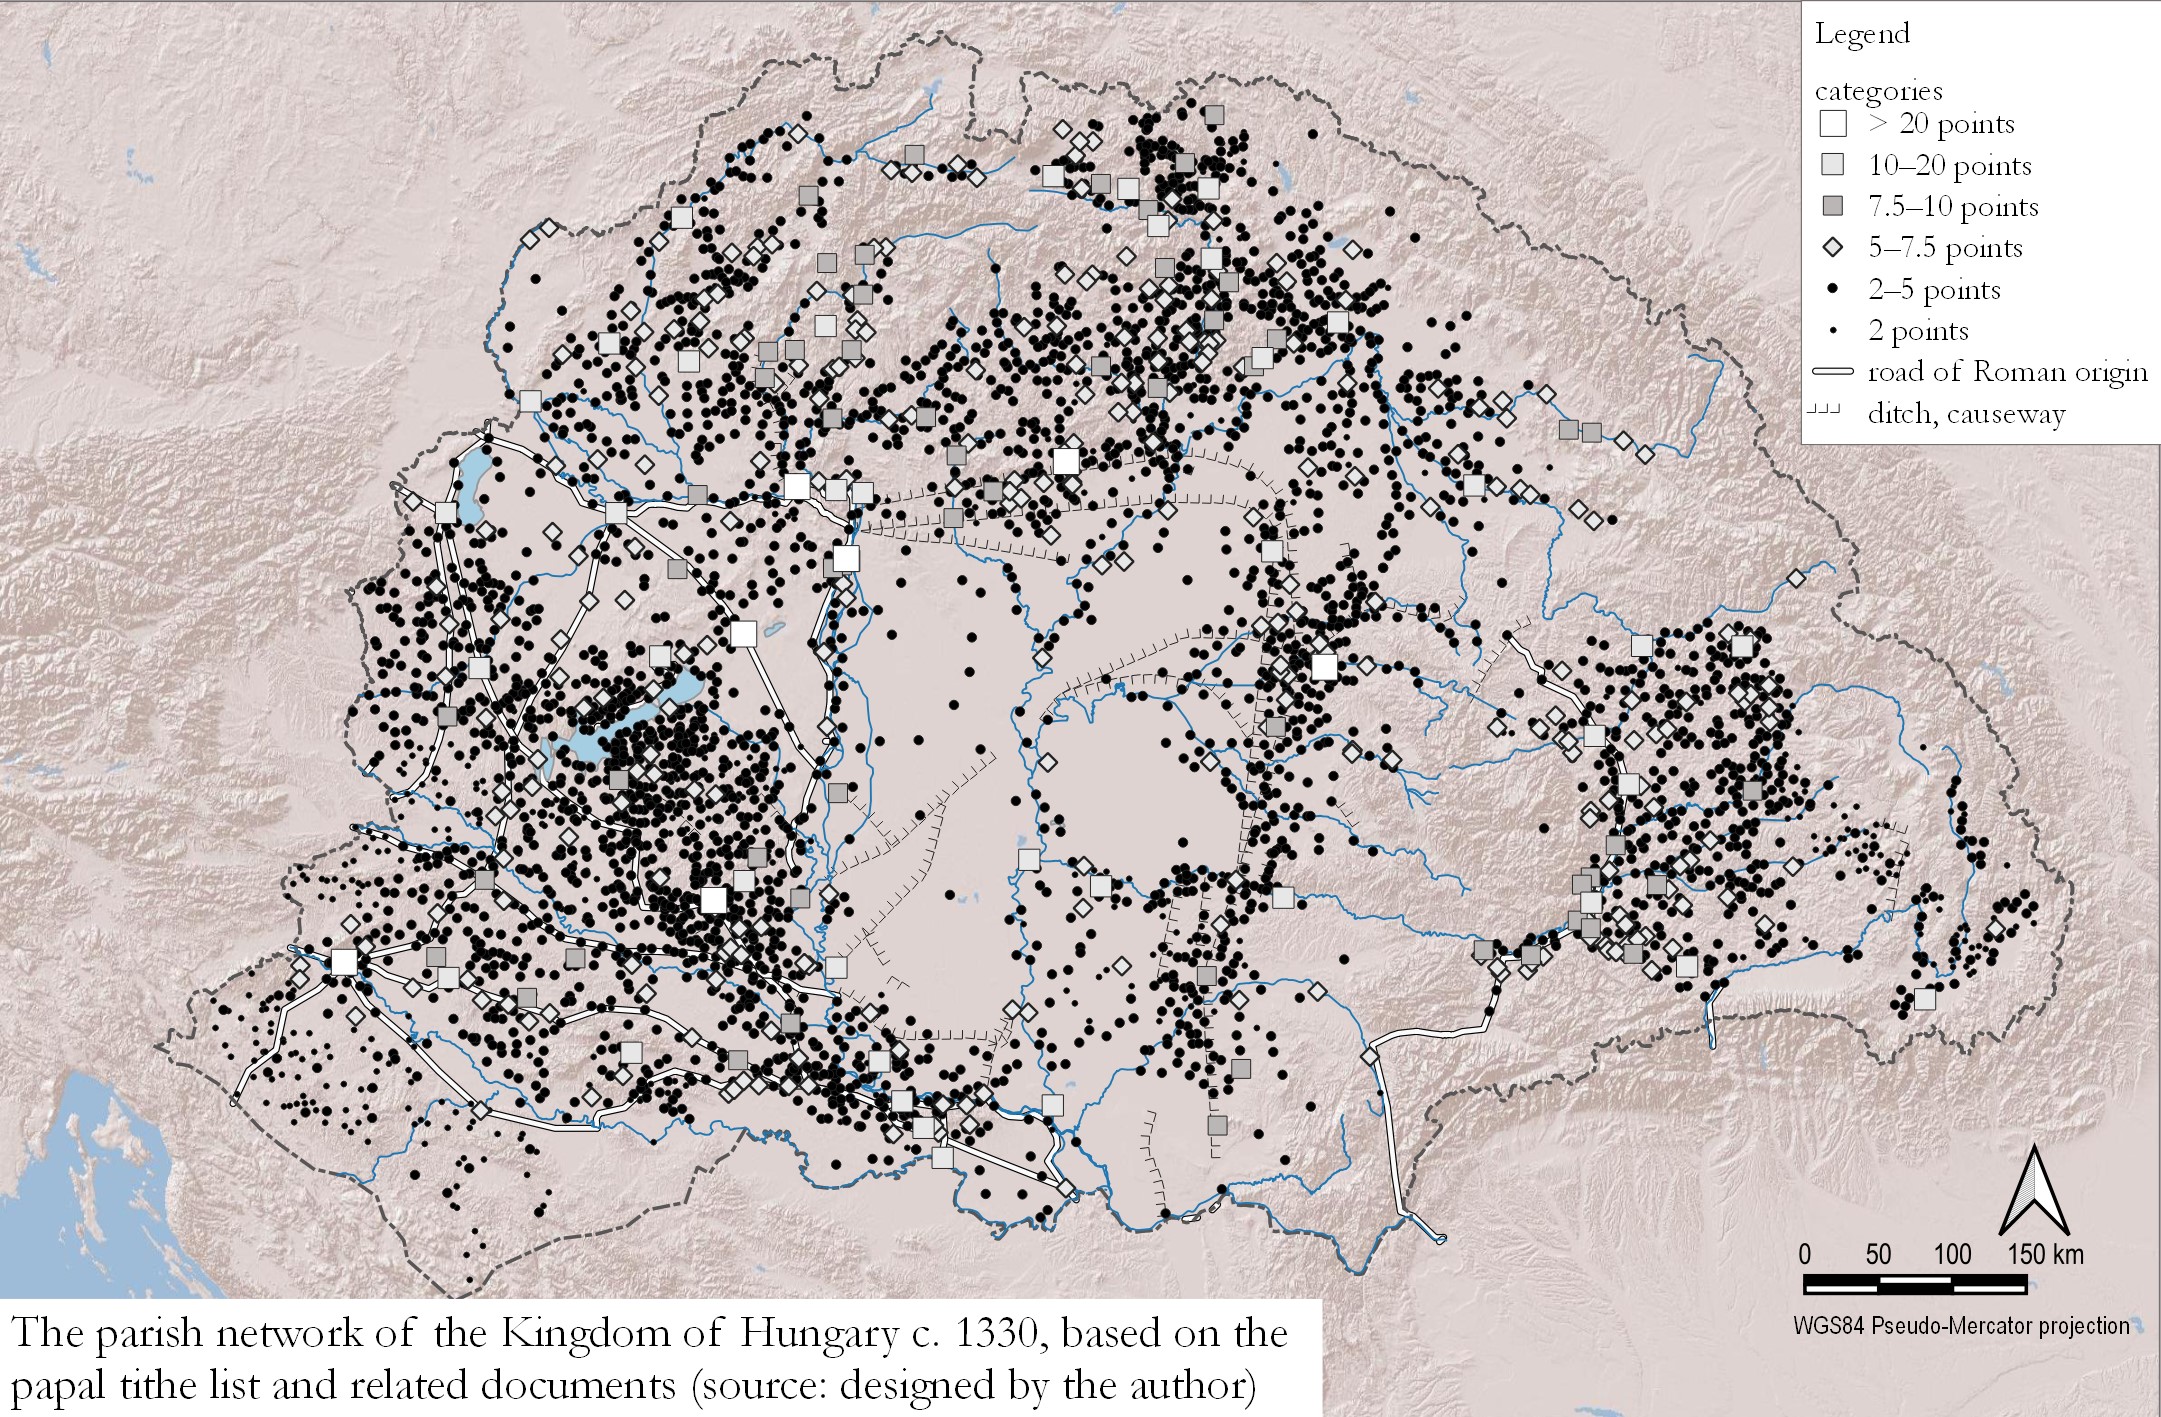
Map 2. The parish network of the Kingdom of Hungary c. 1330, primarily based on the papal tithe list and related documents. Source: designed by the author.

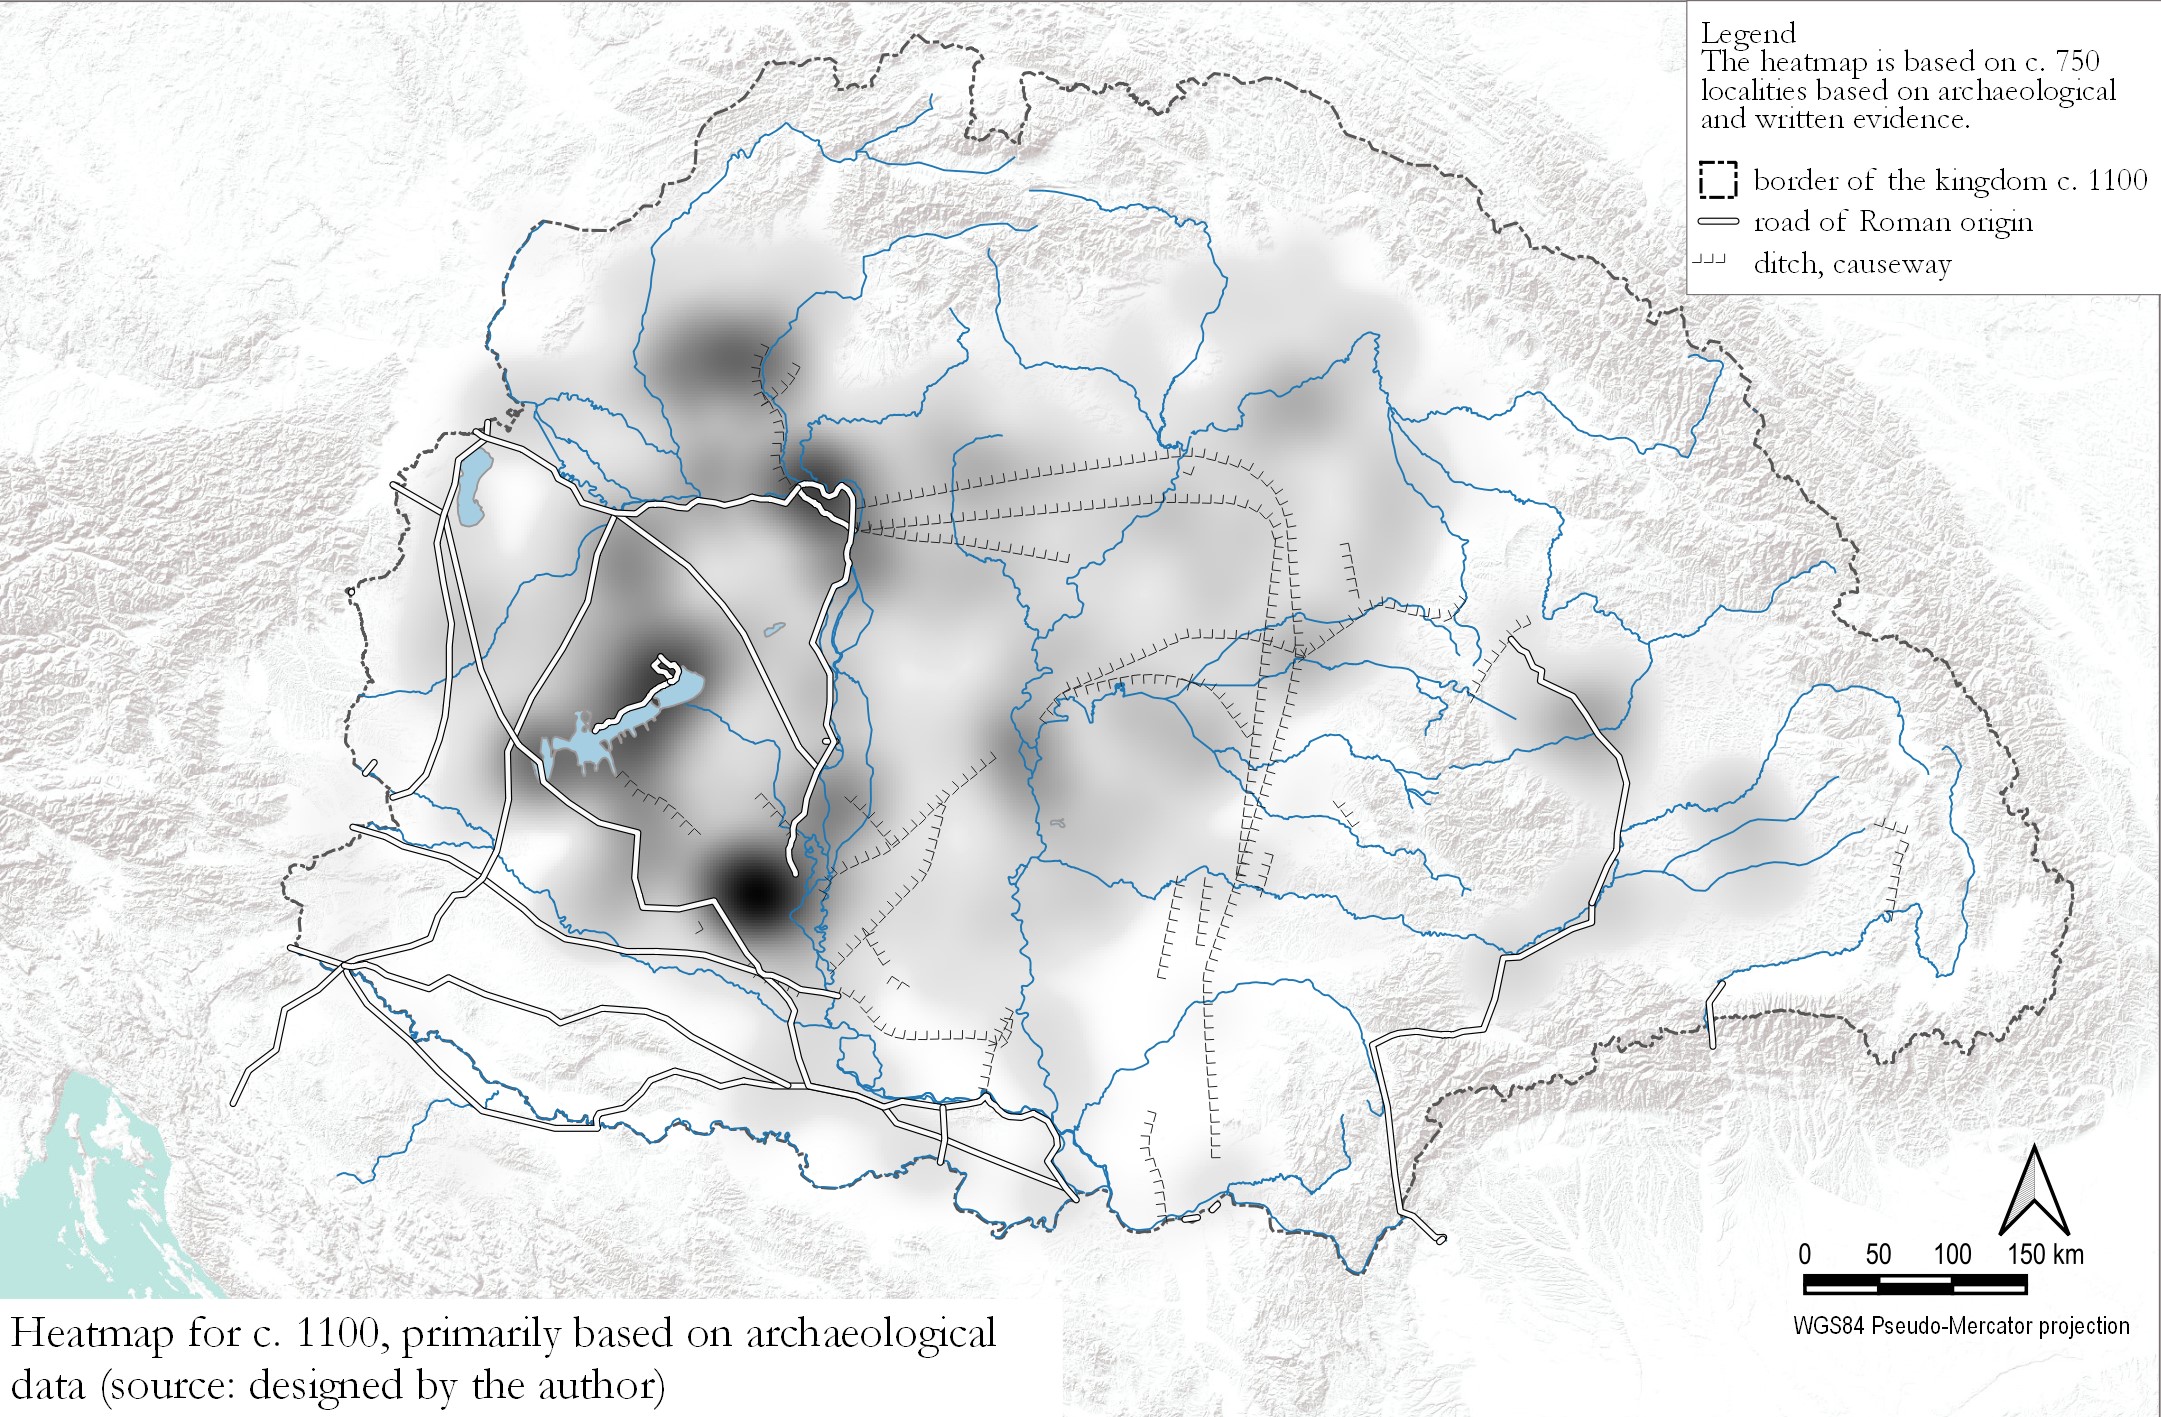
Map 3. Heatmap of the data for c 1100, primarily based on archaeological data. Source: designed by the author.

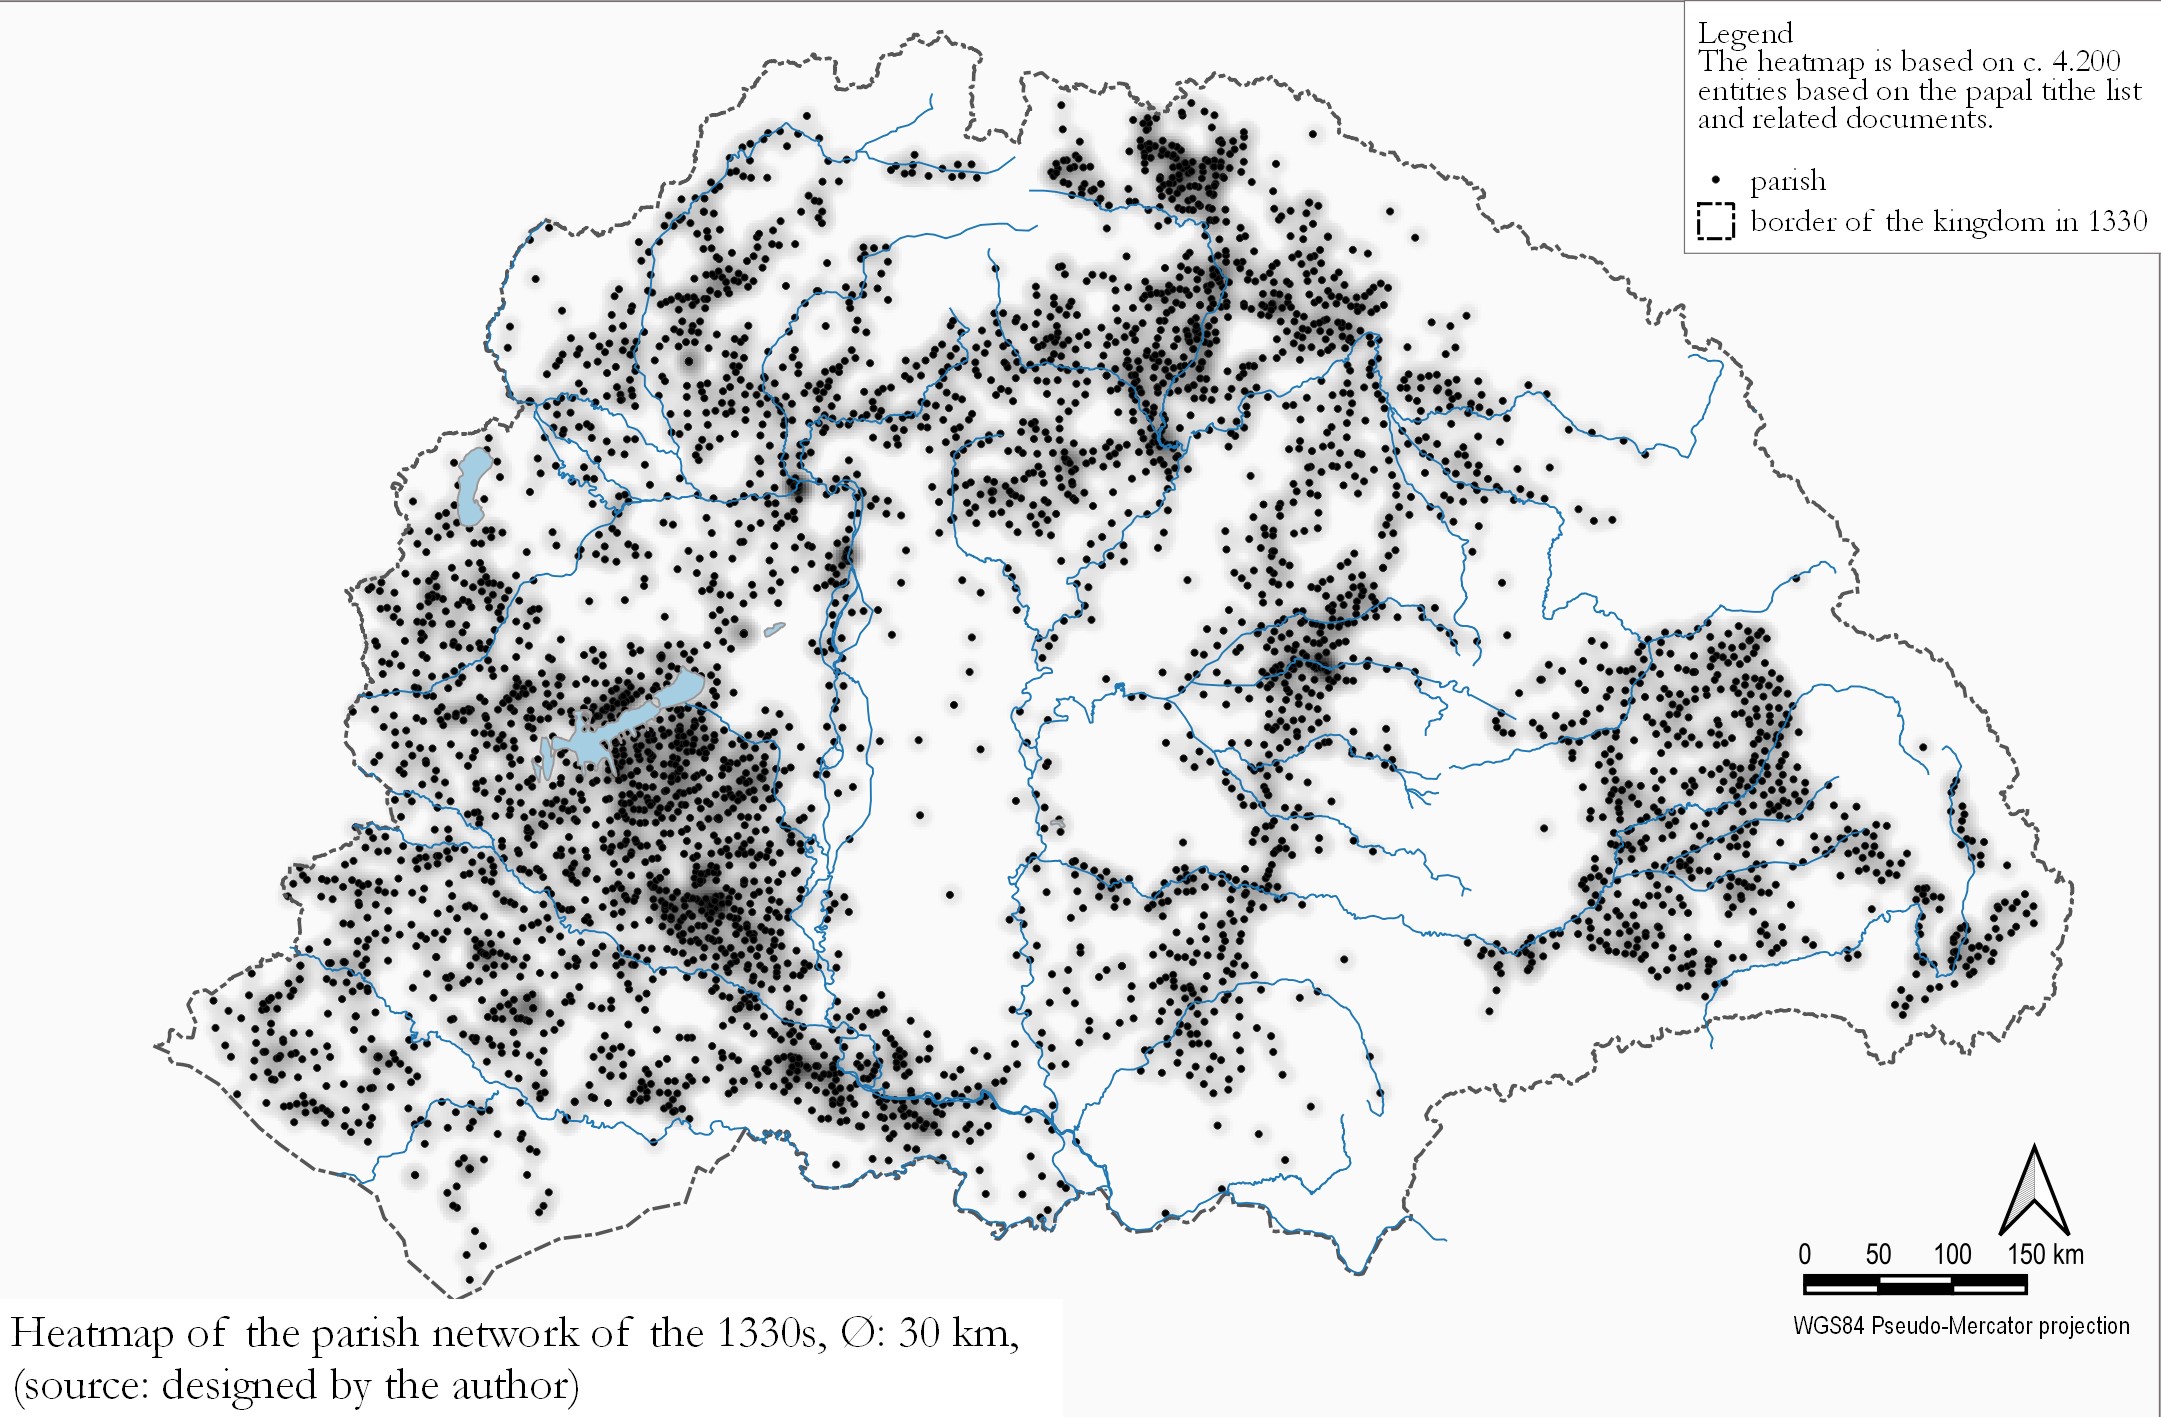
Map 4. Heatmap of the parish network of the 1330s (Ø: 30 km), with the parishes indicated as dots. Source: designed by the author.

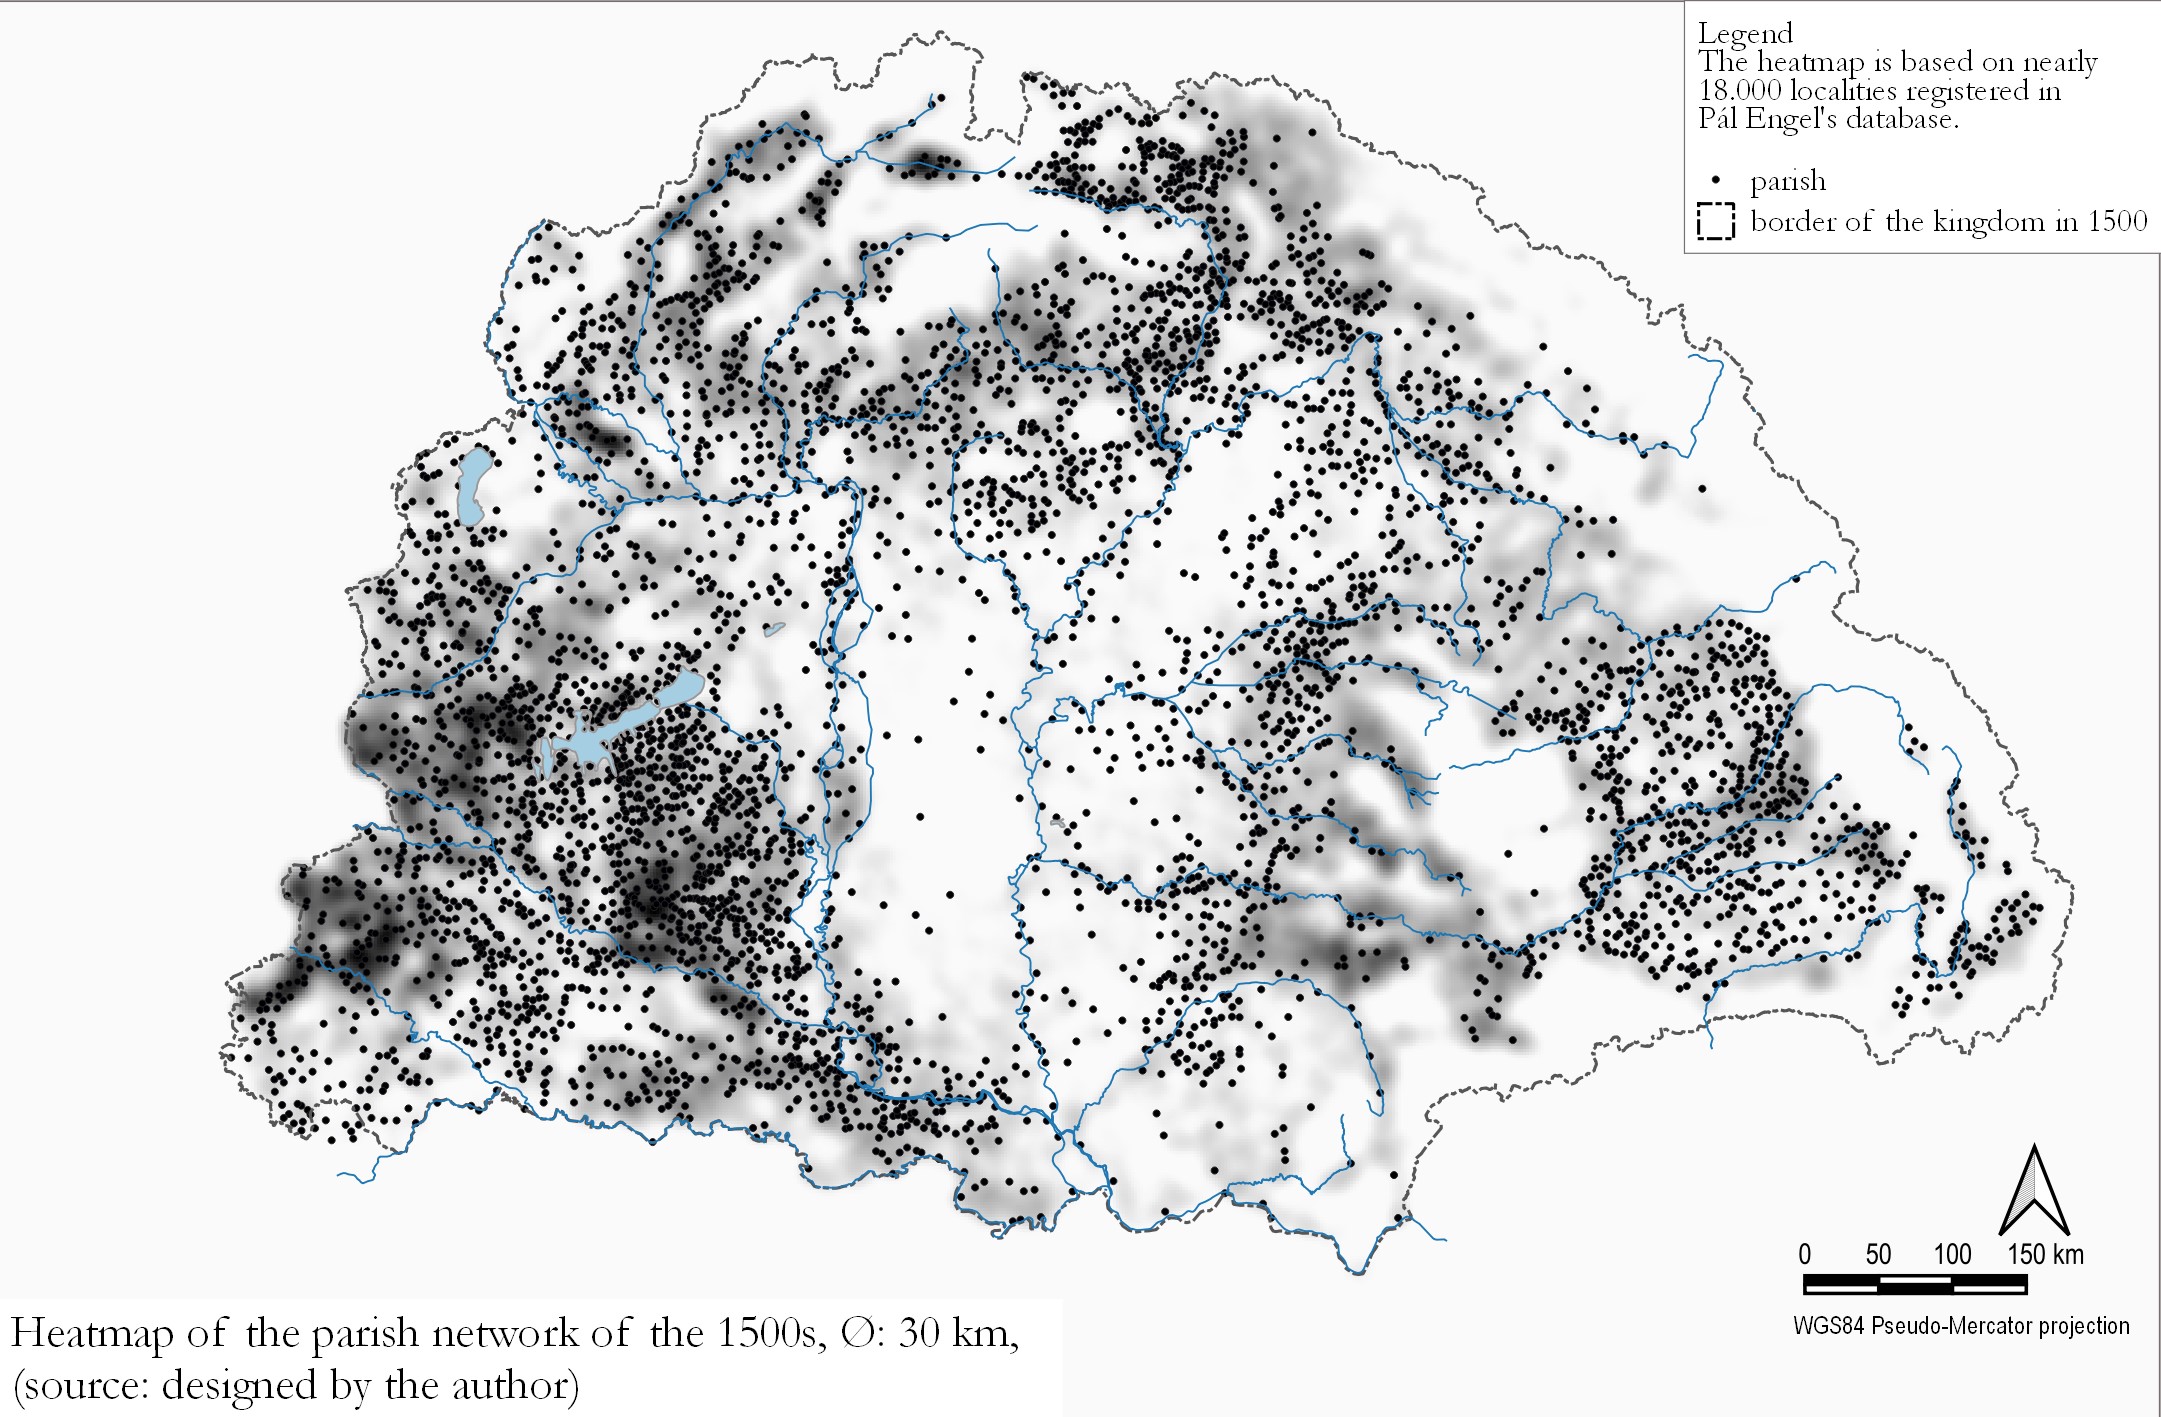
Map 5. Heatmap of the settlement network of the 1500s (Ø: 30 km), with the parishes indicated as dots. Source: designed by the author.

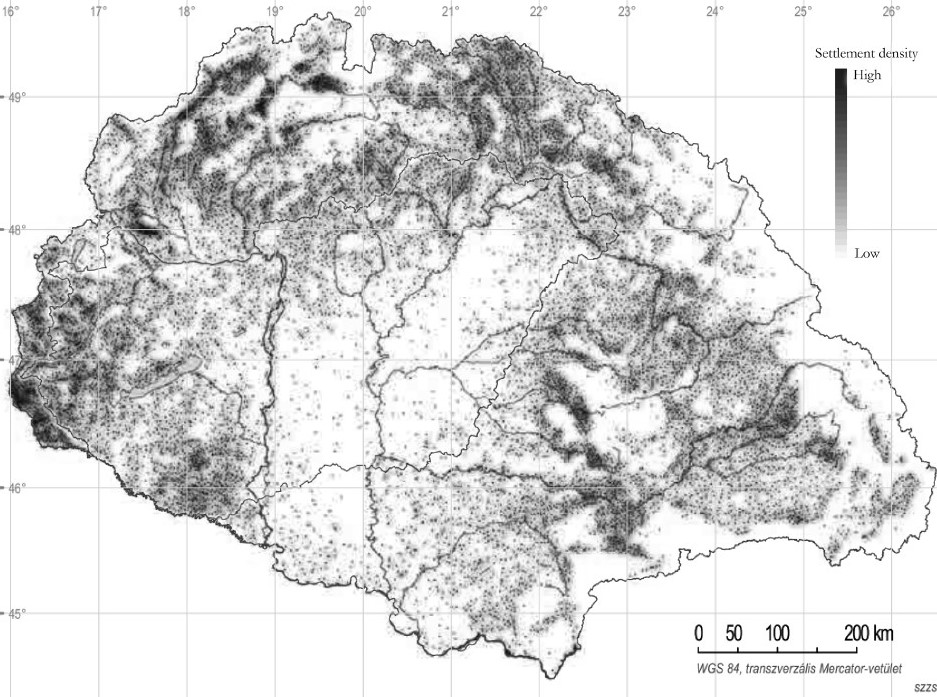
Map 6. Heatmap of the settlement network of 1910, with the settlements indicated as dots. Source: courtesy of Zsolt Szilágyi.

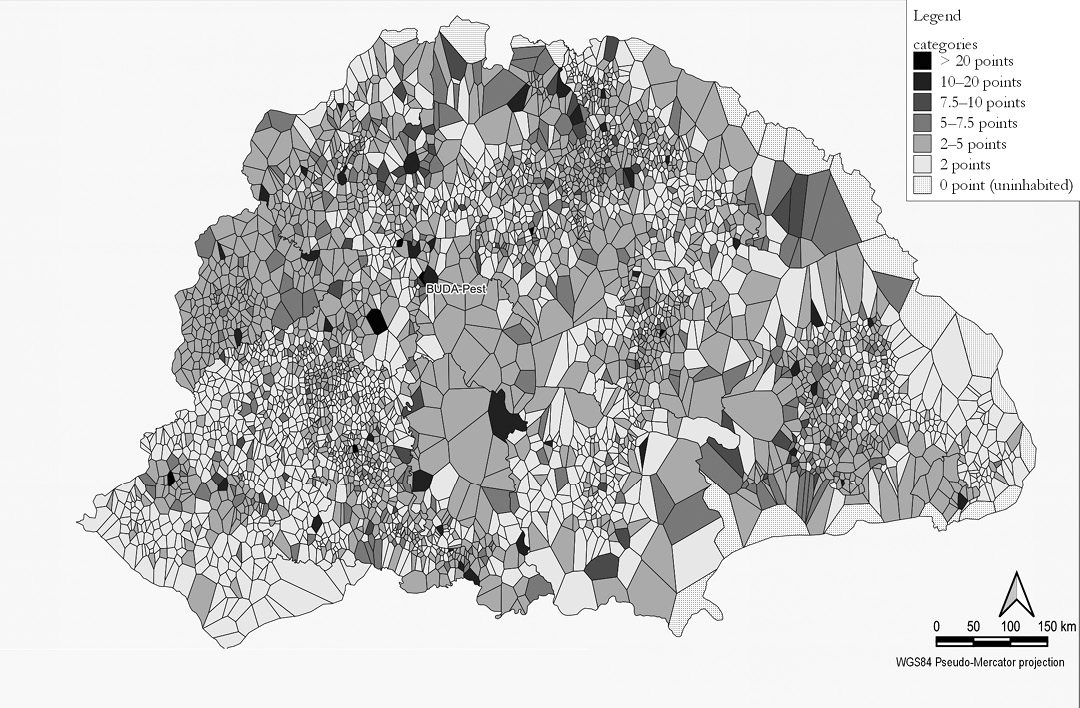
Map 7. Voronoi diagram of the fourteenth-century parish network of the Kingdom of Hungary. Source: designed by the author.

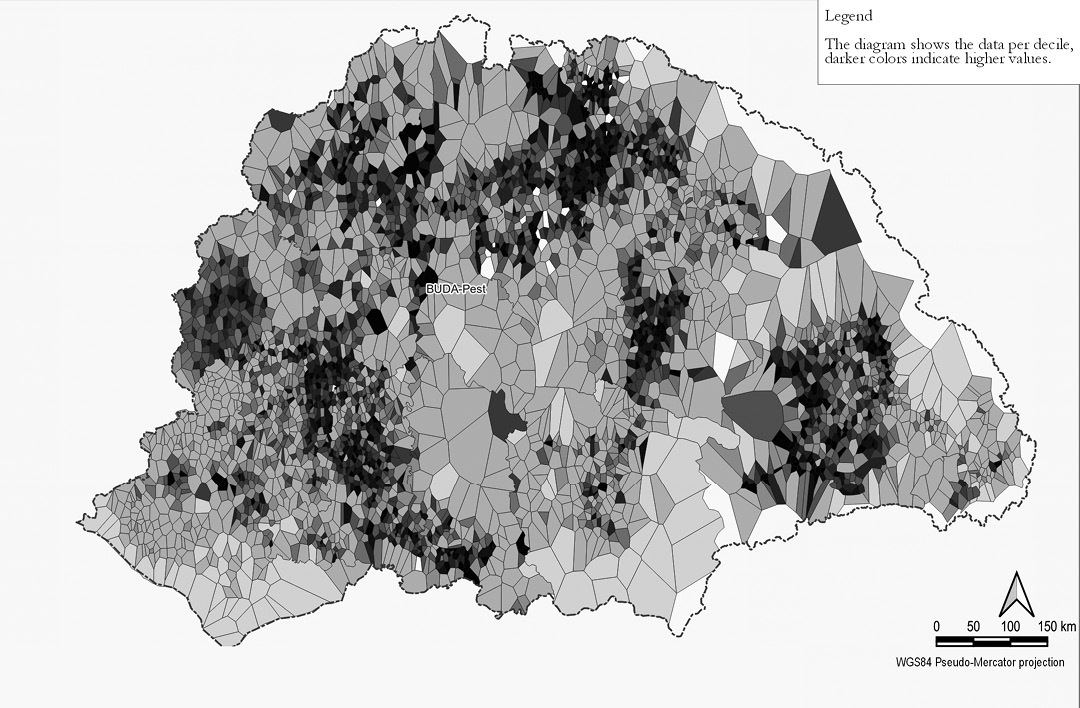
Map 8. Papal tithe per area unit, projected on the Voronoi diagram of the fourteenth-century parish network of the Kingdom of Hungary. Source: designed by the author.
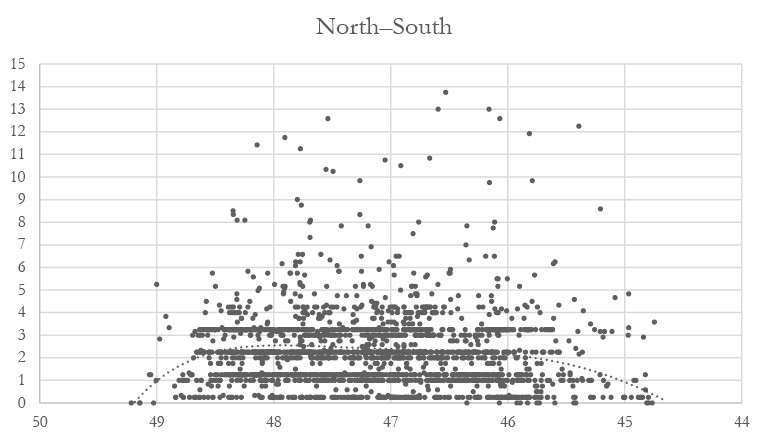
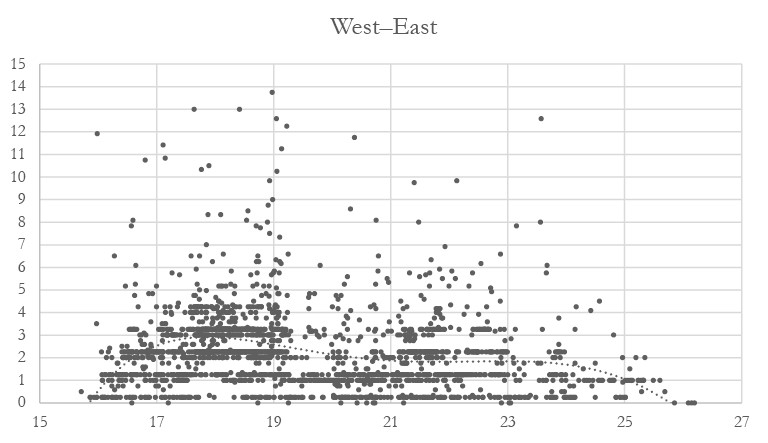
Fig. 1. Development slopes of the Kingdom of Hungary c. 1220. a: West–East section, b: North–South section. Source: database of the author.
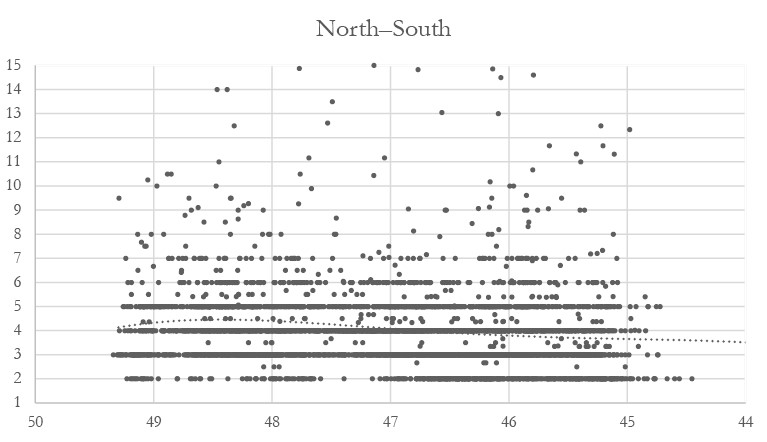
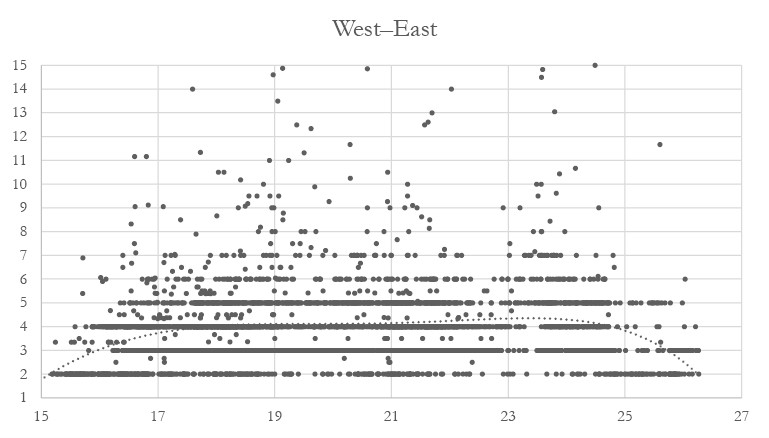
Fig. 2. Development slopes of the Kingdom of Hungary c. 1330. a: West–East section, b: North–South section. Source: database of the author.
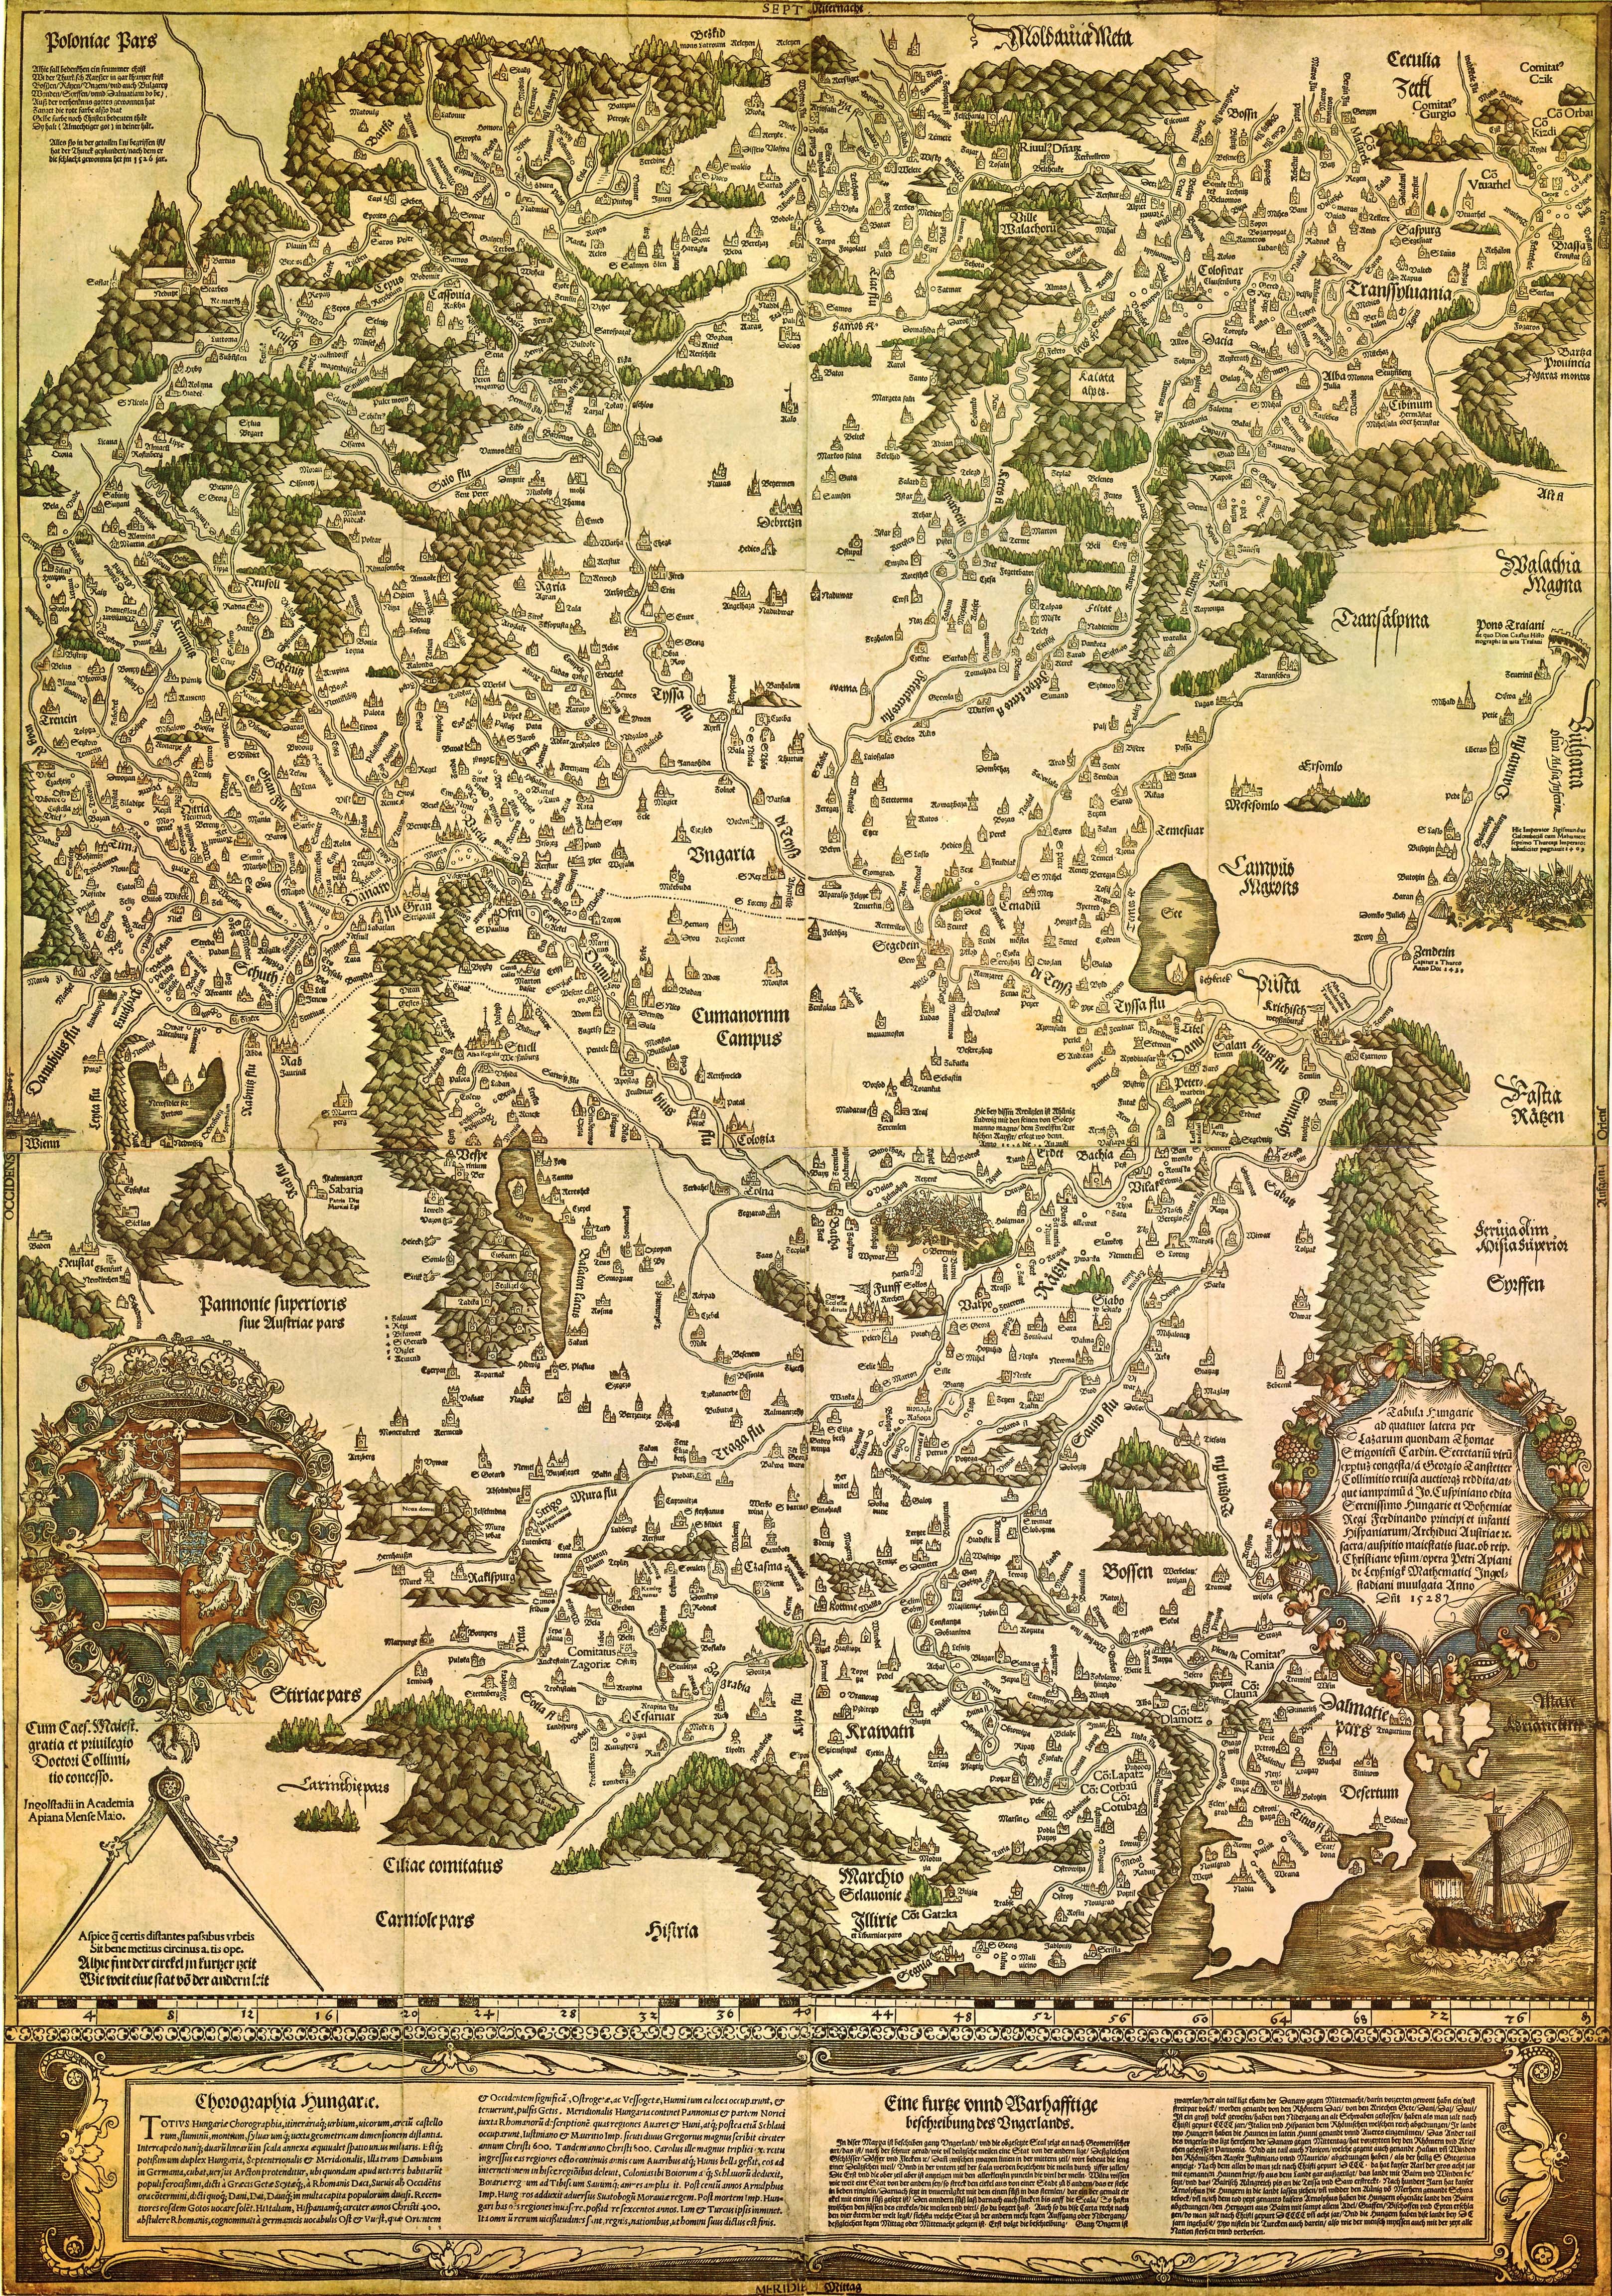
Fig. 3. The Lazarus-map (1528). The shape and the extent of the empty space in the middle of the map corresponds approximately to the loose settlement network of the Great Hungarian Plain, shown by Map 4. On the orientation and projection of the Lazarus map, see Tímár et al., “Orientation.” Source of the image Wikimedia Commons.
2 The project K145924: Regional differences of the Kingdom of Hungary c. 1500 supported by NKFIH, also aims to complement the existing eighteenth-century data set with data on parishes and the data of modern northern and eastern Croatia (medieval Slavonia with Pozsega, Valkó, and Szerém Counties, as well as the parts of Baranya County south from the Drava River). The results of the project and the datasets produced in the course of the pilot projects will be published and modelled in the framework of the GISta Hungarorum database.
3 Rationes; Buturac, “Popis župa Zagrebačke biskupije.” On these and other, smaller sources and their evaluation, see F. Romhányi, “A középkori magyar plébániák.”
4 F. Romhányi et al., “Plébániák és adóporták,” 38.
5 It is worth noting that this part of Roman Pannonia remained under Roman rule after the partition of the province in the fifth century AD, when the northeastern part was ceded to the Huns.
6 Cf. the archaeological evidence, namely the tools connected to viticulture from Migration Period strata. Müller, A mezőgazdasági vaseszközök fejlődése.
7 F. Romhányi, “Plébániák és adóporták,” 936.
8 Ibid., 938.
9 Cf. Kubinyi, “Mezővárosok egy városmentes tájon.”
10 Demeter et al., “A területi egyenlőtlenségek.”

